Measurement & Strategy.
Connect goals to events, interpret reports and explain uncertainty before recommending the next move.

A clear learning sequenceThree phases. Two lessons each.
About 136 minutes34 min reading · ~102 min practice
Make something usefulFinish with your own reviewable project.
A skill you can put to work
Build a measurement plan and a decision-focused report.
A measurement plan
Define the event and how it will be checked.
An honest report
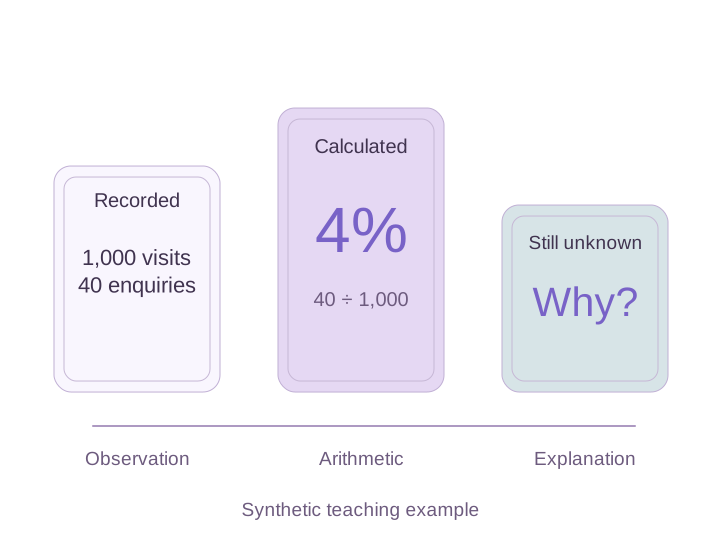
Separate arithmetic from a claim about cause.
A defensible next step
Choose a check that addresses an actual uncertainty.
The curriculum
Your next six
useful steps.
Follow the sequence or return to a lesson whenever you need it. Read, try the task and check your reasoning.
Define what matters
Connect goals to events and understand Search Console metrics.
Read with context
Inspect analytics, attribution and alternative explanations.
Turn evidence into action
Write a decision-focused report and a realistic improvement cycle.
Your final project · The decision lab
A report that leads to a defensible decision
A fictional site records more clicks but fewer enquiries after a form release. Prepare a report that respects the data limits.
A real chance to practice.
A goal/event definition and validation plan.
A short report distinguishing arithmetic from explanations.
One prioritized check and a criterion for the next decision.
Are periods, denominators and event definitions comparable?
Are tracking changes considered?
Does the next step test an actual uncertainty?
One illustrative approach. Your choices can differ when you explain them.
Recorded rate fell from40/1000=4% to30/1200=2.5%.
That observation alone does not establish the cause or revenue effect.
Submit a controlled test and compare event receipt with the business enquiry record.
Your project is yours to keep. Use the example to review your choices, then make it your own.
Find a project worksheet